As a studio or training center owner, you know that keeping track of some of your data is essential to driving the growth of your business. However, it’s not always easy to know which metrics (KPI) to focus on, how to understand cause-and-effect relationships between each of them, how often to analyze them, or when to compare them.
Which metrics are crucial to analyze to take your business to new heights?
1. Comparing your sales and your profitability year-over-year (Sales YoY)
Your revenue is probably the metric you track most regularly, but do you go further than just checking your sales total?
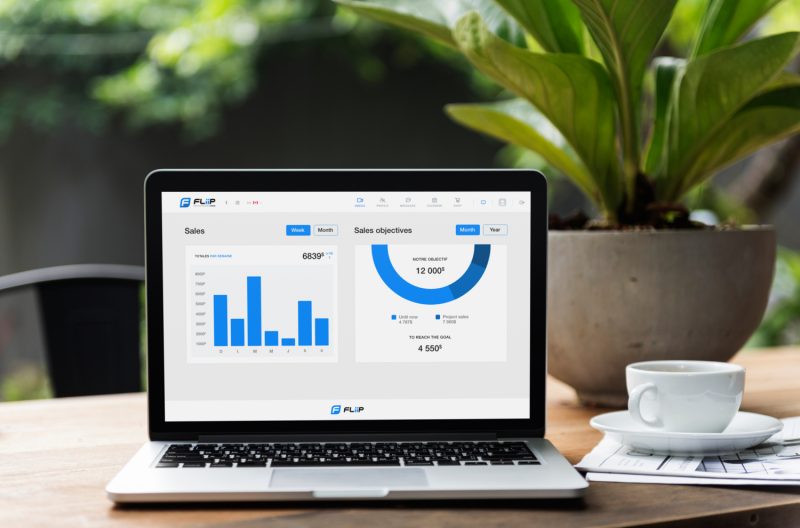
If you want to be sure that your growth is on track, you need to compare this amount to previous years*. We don’t recommend simply comparing your revenue to the previous year’s figure, because variations over the course of the year are normal and shouldn’t alarm you. On the other hand, if your revenue differs considerably from the same period of the previous year, you should deepen your analysis to understand where this difference comes from. For example, has your average revenue per member dropped significantly?
You should also keep an eye on your revenue breakdown by department, as you may have strong growth in your memberships, but see a decrease in your professional service offerings, for example. It is therefore advisable to always analyze growth and profitability by department.
Furthermore, by establishing a growth trend in your revenue, you will be able to forecast your turnover for the next few years, and anticipate the investments and recruitments you need to keep your members happy and loyal.
Finally, we advise you to get into the habit of setting sales objectives at the beginning of each year to challenge yourself and your teams to reach revenue goals. Track your revenue to see whether you’re on target, and don’t hesitate to set up additional actions to boost your revenue if you notice that it is stagnating. Organize a friendly competition, offer a workshop, give your most loyal members a guest pass so they can share their experience with a friend…Get creative with your ideas!
2. Average Revenu Per User (ARPU)
Contrary to what you might think, the number of members in your studio or training center is not a metric that will help you determine whether or not your business is growing. Knowing the average amount spent per member will!

ARPU or Average Revenue Per User is a common metric used to monitor and compare your growth and success to your competitors. To calculate your Average Revenue Per User, you must first define a time period on which to base your calculation. ARPU is usually calculated on a monthly basis, so you simply divide your total monthly revenue by the number of members in that same period.
ARPU = Total revenue / Number of customers
Calculating your ARPU will allow you to compare the value of your new members to the average of your existing members, but also to compare the value of your members for each of the memberships you offer. Your findings will then allow you to determine the entry-level offer to implement to generate maximum revenue, or help you re-evaluate some of your memberships that decrease your overall ARPU. For example, this calculation often reveals that the entry-level subscription should be abandoned because, although it generates a volume of customers, its ARPU well below the average.
In summary, calculating your ARPU will allow you to understand and monitor your company’s financial health.
Note: Calculating your average LEG, “Length of Engagement” will also help you monitor the health of your business. An increasing average LEG is certainly a guarantee of increasing member satisfaction and loyalty, two key elements for your studio’s growth.
3. Churn rate
Dreaded by all businesses operating on a subscription or monthly payment system, customer churn and non-renewal are inevitable. Keeping track of them, and monitoring your churn rate is a must.

Here is the formula to quickly calculate your churn rate, knowing that the industry average for studios and training centers is about 30% accumulated over the year:
Churn rate = (Number of members lost / total number of members before losing them) * 100
So, a training studio with 300 members that loses 7 members in one month would have a churn rate of 2.3% for that month. If this rate remains stable throughout the year, the cumulative churn rate for the year would be 27.6%.
One of your main goals should be to get your churn rate down every month, and stay below the industry average of 30% cumulative per year, or about 2.5% per month. It is important to understand that if your studio or training center runs at 8% churn rate per month all year long, you will have renewed your entire client base in 1 year! This means that your ability to retain your members is weak or non-existent. However, the retention of your ideal customers is one of the key elements that determine the reduction of your costs and the growth of your company. Since acquiring new customers costs on average 5 times more than retaining your existing ones, lowering your churn rate by a few percent every month will have a real impact on your growth (in addition to the satisfaction of making more of your customers happy).
Example 1: A gym with 150 members and a churn rate of 5% + 10 new members per month = 168 customers at the end of the year, or $1600 in ADDITIONAL revenue every month if your monthly ARPU is $89.
Example 2: A gym with 150 members and a churn rate of 8% + 10 new members per month = 134 customers at the end of the year, or $1400 LESS revenue every month if your monthly ARPU is $89.
To reduce your churn rate as much as possible, you need to understand your members’ interests and goals so that you can offer them the maximum value. If you are concerned about your high churn rate, don’t hesitate to send a satisfaction survey to all of your active customers. It is also a good idea to ask members who have just left your training center why they decided to cancel their membership (you are authorized by law to contact them within 24 months of their cancellation).
4. Lifetime Value (LTV) et Acquisition Cost (CaC)
LTV is sometimes confused with ARPU. The difference is that LTV is calculated by dividing your ARPU (Average Revenue Per User) by your churn rate.
LTV = ARPU (Average Revenue Per User) / Churn rate
Your members with the best LTV are those who consume the most of your services (e.g. an annual membership, sessions with a private coach, massage therapy services, and several event participations, for example), for the longest time (note: when the average lifespan of your clients is 2 years, these subscribers have been loyal to you for 3 years or more), or who have subscribed to your most expensive membership. These customers are ambassadors for your company. Don’t hesitate to offer them consistent companionship, invite them to your events and reward them when new members subscribe thanks to their referral.
In summary, calculating LTV allows you to understand and track the total average value of a particular customer. This information allows you to determine how much you are willing to pay to acquire your customers in general, and by channel, without jeopardizing your profitability.

Understanding and monitoring your acquisition cost per channel is a powerful lever to make your growth exponential and limit your losses! For example, calculate the CaC and LTV of clients who registered for an event, took advantage of a trial offer or were referred by other members to find out which channel is the most profitable and to implement strategies to accelerate it.
For example, if your acquisition cost is $100 for one of these channels, but the average LTV of your customers is $500, you are winning by $400 ahead (and even more so if you manage to improve the average LTV over time, for example by decreasing your churn rate).
In this example, your LTV/CAC ratio is 5. As a general rule to keep your acquisition model healthy, try to never go below a ratio of 3.
5. Your at-risk members (inactives, non-renewed or dissatisfied)
Your at-risk members are those whose attendance frequency is decreasing (inactive for more than 14 days), those who have not renewed their membership, and those who have left a neutral or negative review of your business on one of your networks or on surveys you sent them.
Note: FLiiP will soon offer surveys to send to your members after each of their experiences in your studio or training center.
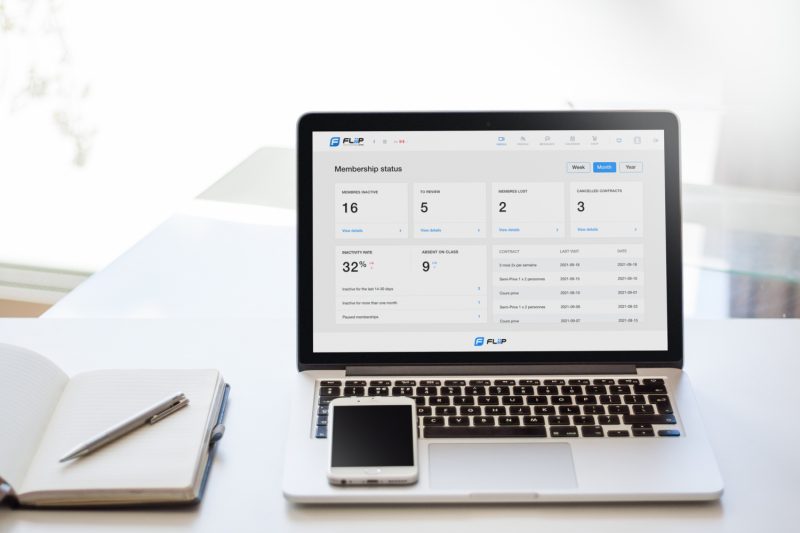
Once you identify your at-risk members, we recommend that you schedule a call with a customer success resource.
For example, contact the people who have not been coming to your studio for over 2 weeks to find out why, as there could be many reasons! Once you have gathered your members’ feedback, offer them tailored solutions to make them feel special: for example, a session with a private coach for a loss of motivation.
Remember that retaining your existing members will always cost you less than attracting new ones.
In summary, your goal should be to reduce the number and percentage of your at-risk members as much as possible, and to implement winning strategies to communicate with them before it’s too late.
Keeping an eye on these 5 essential metrics will ensure that you have all the right cards in hand to boost your business growth.
Training center owners who use our complete dashboard have let us know how much of a game-changer it has been for their business! Contact us for a peek at the detailed real-time reports that FLiiP provides owners. We would love to accompany you in your daily business management!
*Your comparisons with last year could be distorted because of COVID. We advise you to compare your statistics against 2019.